Executive Summary
Despite the rising popularity of new fee-for-service financial planning service models, remarkably little has actually been published about how financial advisors price their services. Which is an important topic for both consumers – who want to know what a plan might cost – and for financial advisors themselves, who may want to benchmark whether the pricing for their financial plans is “reasonable” relative to their advisor peers and competitors (rather than solely setting the price based on its time-and-labor cost to the advisor), especially in an environment where fees on financial products have been under intense price competition and fee compression!
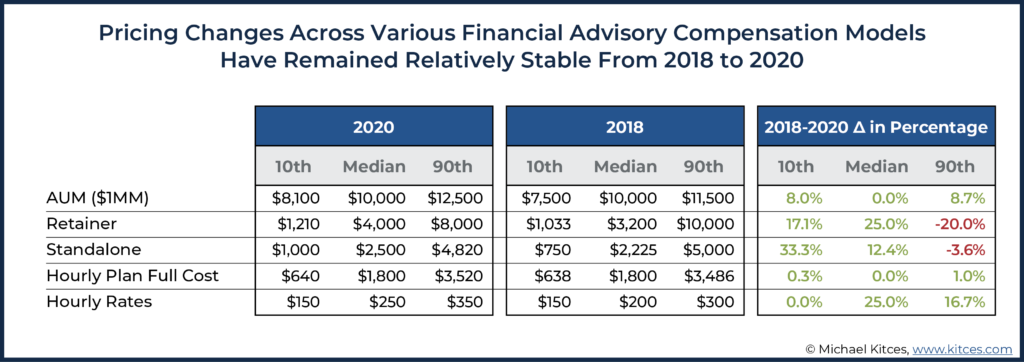
In our latest 2020 Kitces Research survey on “How Financial Planners Actually Do Financial Planning”, we examined both how financial advisors are charging and how much they are charging their clients for financial planning services. Although there has been concern that the fee compression evident with financial services products would also apply to financial planning advice, we found little evidence that this was the case. On the contrary, our data suggests that the median fees in 2020 significantly increased, relative to 2018 fees, for standalone fees (12.4% increase) for retainer fees (25% increase), and for hourly fee rates (25% increase). Median AUM fees, though, remained relatively steady, with no apparent increase (though there was an 8% increase at the 10th percentile and an 8.7% increase at the 90th percentile for fees charged for a $1 million portfolio).
We also observed pricing trends by industry channel, with advisors in the RIA channel charging higher median fees than those in the B/D channel for work completed on a standalone or retainer basis, as well as for a complete financial plan billed on an hourly basis. Similarly, financial advisors with a CFP designation generally charge higher fees than those who are not CFP professionals.
When it came to team structure, there was not much difference in standalone fees charged by solo advisors, solo advisors with support, and ensemble advisors, although silo advisors do appear to charge lower standalone fees than other team structures. For financial plans completed on an hourly basis, silo teams had the highest median fees and solo advisors the lowest, while there was the opposite trend observed for retainer fees, with the highest median fees charged by solo advisors and the lowest median fees charged by silo teams.
Because advisors provided us with detailed information about their business practices and pricing, we were also able to compute implied hourly rates for advisors using non-hourly billing models, which can be helpful in understanding what “reasonable” rates are for hourly advisors. At median levels, we found that primarily AUM advisors are generating revenue at rates that would imply hourly fees between $350 and $800. This is in stark contrast to the $100 to $300 implied hourly fees generated by advisors operating on a primarily hourly basis, and speaks to the challenge of building an hourly practice that is as financially successful as advisors operating on an AUM basis at common fee levels. Furthermore, when we look at top-earning AUM advisors (defined here as those between the 85th and 95th percentile), we find that these advisors are generating implied hourly fees in the $950 to $1,600 per hour range.
Ultimately, the key point is that there does not appear to be any overall trend of decreasing financial planning fees, despite common claims that fee compression is coming for financial advisors. Rather, the trends we actually see in our financial advisor research are increasing fees. Furthermore, these trends are observed consistently across advisor fee models. Which suggests that, despite strong proclamations to the contrary, financial planning fee compression may be largely a mirage.
As financial advisors increasingly shift from being compensated for financial planning through the sale of products (and the commissions they pay), and into a realm where advice is compensated by fees, financial advisors suddenly face the proposition of needing to figure out what fees to charge, and what is “reasonable” and competitive in the marketplace.
While some early research on financial advisor pricing has begun to provide greater insight into how much advisors charge for financial planning – including a 2012 study by the Financial Planning Association, Bob Veres’ 2017 Inside Information study, and our own 2018 Kitces Research Study – there’s still a lot to learn about how advisors actually charge for financial planning services, including how, if at all, advisor pricing is changing over time. Especially in a world where the fees on financial services products are under intense price competition and fee compression… and questions abound as to whether financial advisors and the advice fees they charge are next.
To explore the topic of advisor pricing further, we conducted our 2020 Kitces Research Financial Planning Process Study. Over 800 financial advisors participated (thank you!), giving us very detailed information on their practices and how they go about both delivering and pricing their financial planning services with clients.
Notably, one of the first challenges in characterizing the compensation of financial advisors, though, is simply all the ways that financial advisors are compensated for financial planning.
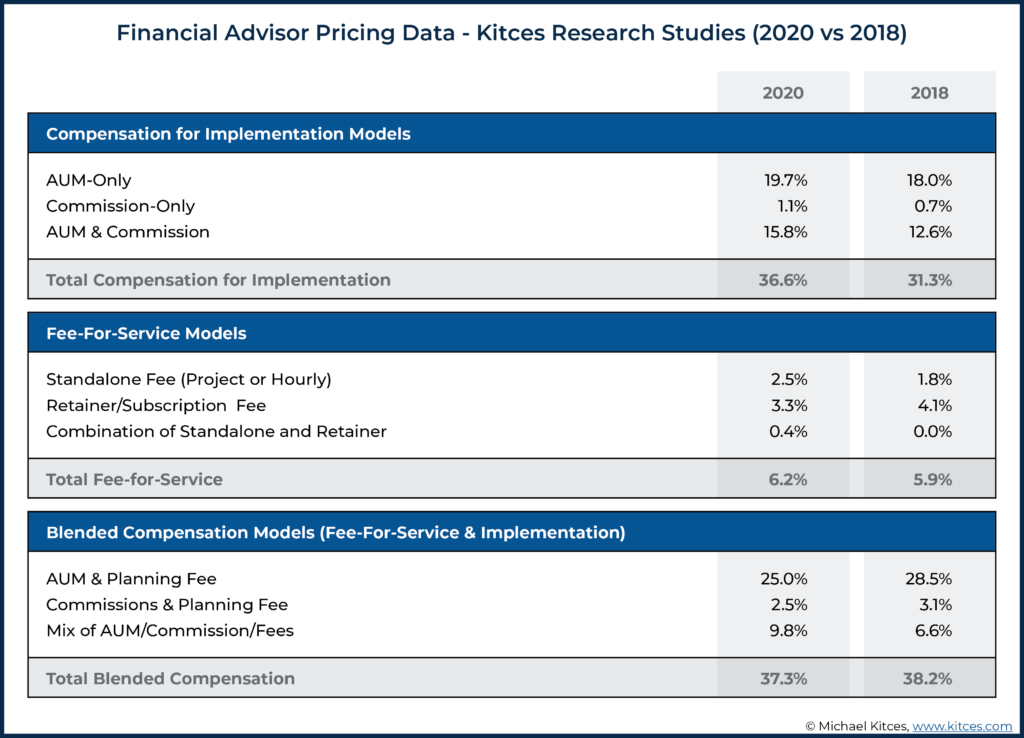
In essence, advisor compensation can be broken down into three broad categories: compensation for implementation (e.g., AUM fees for a portfolio, commissions for the sale of a product, or some combination thereof), fees-for-advice services (e.g., standalone planning fees, retainer fees, subscription fees, etc.), or a combination thereof (fee-for-service and implementation).
Overall, AUM-only and AUM with other planning fees (e.g., charging separately for planning as well via either retainer, hourly, or project fees), remain the most popular compensation models amongst financial advisors doing financial planning in our sample. Commission compensation primarily remains a secondary form of compensation, if advisors receive it all, with only 1.1% of advisors within our sample being compensated entirely by commissions.
Pricing of AUM And Other Compensation Models Used By Financial Planners Has Remained Relatively Stable Over Recent Years
Given that our most recent 2020 Kitces Research Financial Planning Process Study was a repeat of our study in 2018, we have an opportunity to examine what, if any, trends we see overall in advisor fees.
At a high level, we generally do not see much evidence of fee compression. In fact, the median standalone financial planning fee was up 12% from 2018, the median retainer fee was up 25%, and the median hourly fee was up 25% as well. In addition, 10th percentile fees (e.g., what advisors tend to charge on the low end) were also up, 33% for standalone fees and 17% for retainer fees. The only evidence of any “fee compression” was at the very top of the range, where the highest fees that advisors charge did come down slightly; overall, though, the range of advice fees only “compressed” in that the range from top to bottom decreased, but the minimum and median fees that advisors charged were actually up, significantly, over the past 2 years!
Our findings are in notable contrast to the common claims that fee compression is “coming” for financial advisors. As even though it’s nearly 10 years into the robo-advisor movement, there is little evidence of fees declining despite the continued growth of lower-cost advisory platforms; in fact, as financial advisors bolster their value propositions beyond the portfolio alone, advice fees (both minimum and median) appear to be on the rise.
Typical Standalone Fees For Financial Planning
Advisors charge for financial plans in a number of different ways. Perhaps the simplest and most direct way to charge for a comprehensive plan is as a quoted standalone fee (e.g., a project-based fee that is quoted upfront for the creation and delivery of a financial plan to a client).
Overall, roughly 25% of advisors who completed our survey reported that they do produce and charge for standalone financial plans for clients.
Standalone planning fees varied as follows:
- 10th Percentile: $1,000
- 25th Percentile: $1,500
- 50th Percentile: $2,500
- 75th Percentile: $3,000
- 90th Percentile: $4,800
In addition to the 2018 and 2020 Kitces Research studies on advisor pricing, we have also released the 2019 Kitces Research Advisor Marketing Study and the 2020 Kitces Research Advisor Wellbeing Study. And, by examining the results from all of these studies, we’ve started to see some consistent dimensions over which advisor fees vary. As while there was very little variation in standalone planning fees in general, we found that advisors did vary in these fees based on certain characteristics.
Some of the most common ways that financial advisors can be meaningfully segmented include industry channel (RIA versus B/D), CFP certification status (CFP professional versus non-CFP professional), and advisor team structure using a framework similar to Philip Palaveev’s, which include the following structure types:
- Solo advisors (professionals working solely on their own without support staff);
- Solo advisors with support staff (a sole lead advisor that has support staff such as administrative or paraplanner support);
- Silo advisors (advisors who share some overhead and expenses as part of a team, but each manages their clients independently and is ultimately responsible for generating their own revenue); and
- Ensemble advisors (a team of advisors serving clients in an integrated manner).
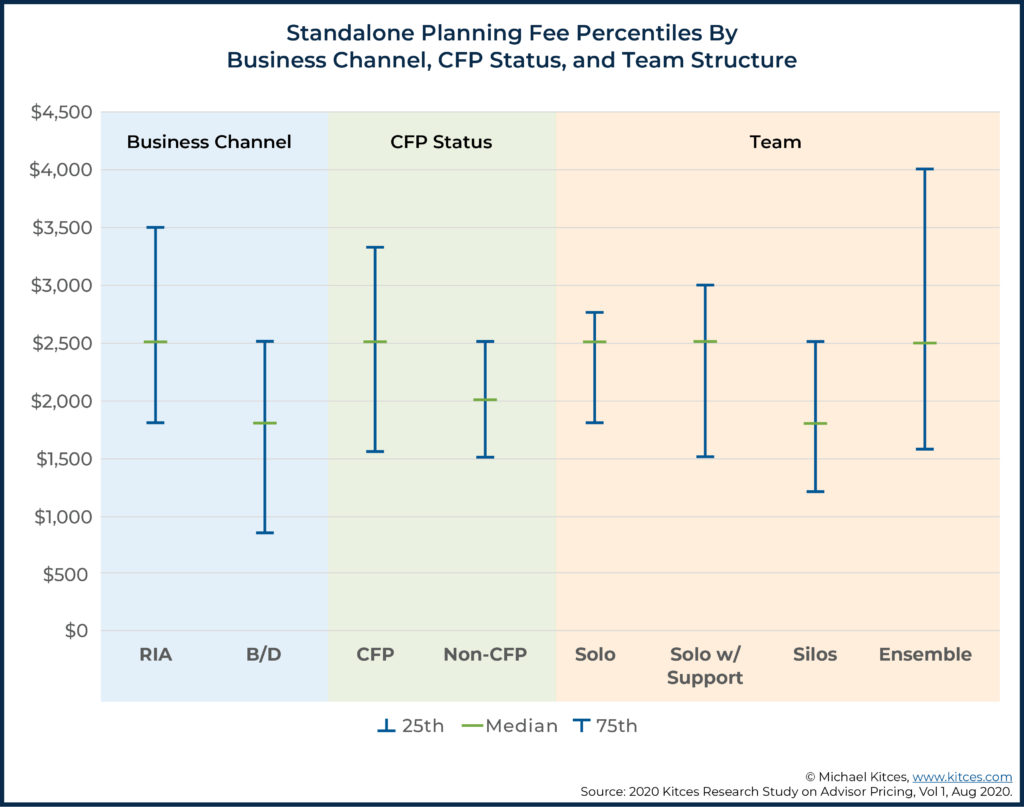
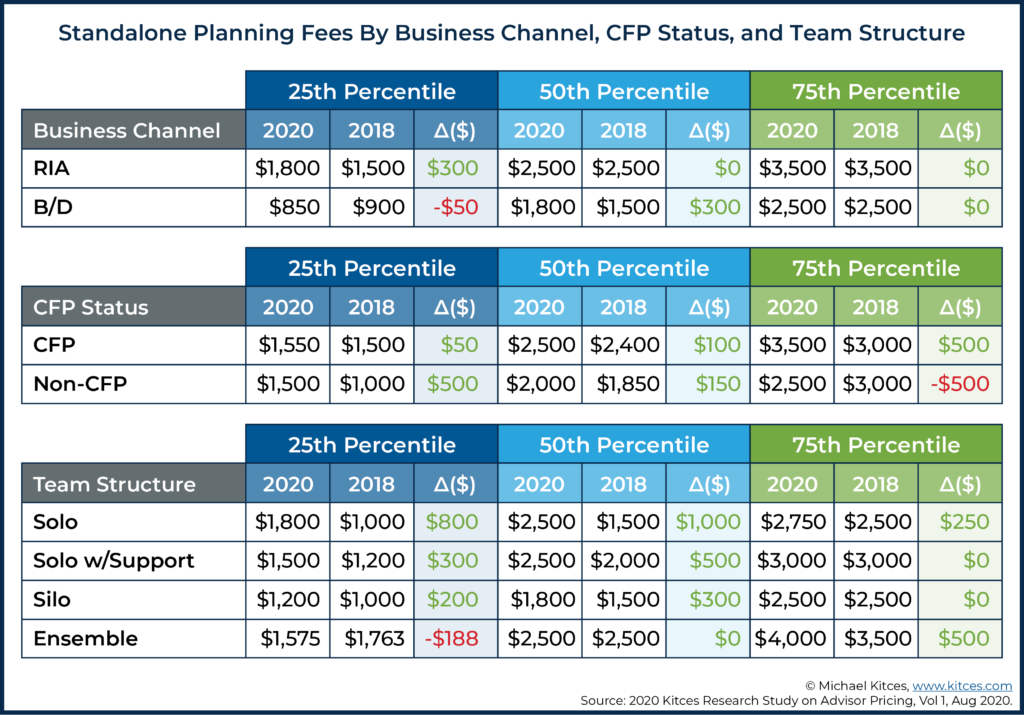
Examining standalone planning fees across these dimensions, we see that advisors solely within the RIA channel reported charging higher median fees than those solely within the B/D channel ($2,500 for RIAs versus $1,800 for B/Ds at the median). Notably, this gap did close by $300 from 2018 to 2020, perhaps suggesting that advisors within the B/D channel are increasingly adopting a fee-for-service business model of charging a more ‘full-value’ fee for financial planning (rather than a discounted financial planning fee that is made up with subsequent commissions for implementation), though the gap in financial planning fees between RIAs and the B/D channel remains still significant, nonetheless.
At the median, CFP professionals reported charging $500 more for a comprehensive plan than non-CFP professionals ($2,500 versus $2,000). Notably, our research shows that advisors who tend to go deeper with their planning also charge more (for what is literally a ‘more comprehensive’ financial plan), so it is not surprising to see CFP professionals charging more than non-CFP professionals.

Nerd Note:
The fact that CFP certification status is correlated with higher fees does not necessarily mean that earning one’s CFP mark is what causes advisors to earn higher fees. It is very likely that the expertise gained in pursuing one’s CFP certification and the signal that the designation sends to consumers may help advisors earn higher fees from consumers in the marketplace, but CFP professionals also differ from non-CFP professionals in important ways (experience, background, professional success, etc.) that could also explain why CFP professionals earn higher fees. Prior research from the CFP Board has also suggested that earning CFP certification leads to an increase in advisor self-confidence, which throughout this research also appears to be an indicator of higher fee levels and pricing confidence.
By contrast, at the median, we don’t really see much difference in fees charged by team structure (solo advisors, solo with support, and ensemble advisors all report median fees of $2,500), although we do see lower fees charged among silo advisors with a median of $1,800, and the variability of fees is the widest for the largest ensemble RIAs (which at the low end charge similar fees to other team structures, but at the high end are commanding the highest financial planning fees at the 75th percentile). Which isn’t entirely surprising, as separate industry research has shown that the largest ensemble advisory firms also tend to disproportionately attract the most affluent clients who are most capable of paying the highest advice fees.
Our Kitces Research also observed some variation in standalone planning pricing based on how ‘comprehensive’ planners really are when creating their financial plans. To assess the level of comprehensive planning, we asked advisors to indicate which of the following 16 topics they cover within a comprehensive financial plan:
- College Funding
- Student Loan Analysis
- Cash Flow/Budgeting
- Life Insurance
- Disability Insurance
- Long-Term Care Insurance
- Property & Casualty Insurance
- Savings/Accumulation Analysis
- Retirement Spending/Distribution Analysis
- Tax Planning
- Estate Planning
- Investment/Portfolio Analysis
- 401(k) Analysis
- Employee Benefits Review
- Stock Options/Restricted Stock Analysis
- Career/Salary Benchmarking
Advisors were then classified according to how many topics they cover, including “Targeted” (0-5 topics), “Planning Lite” (6-9 topics), “Comprehensive” (10-12 topics), and “Most Comprehensive” (13+ topics). The percentage of advisors within each category, as well as changes from our 2018 study, are reported below:
As the chart above indicates, advisor representation in each group was fairly consistent between 2018 and 2020. The only change we observed was a slight shift from the “Most Comprehensive” group to the “Comprehensive” group, as some advisory firms appear to be finding a level of diminishing returns where being ‘extra’ comprehensive in the depth of the plan may not command enough in additional advice fees to merit the additional depth. Which is consistent with our separate Kitces Research findings that advisors who have a clearly defined target market are able to command higher advice fees with less comprehensive (but more relevant and focused) financial plans for the particular needs of their target market (instead of just trying to do the most comprehensive plan for any/every possible client).
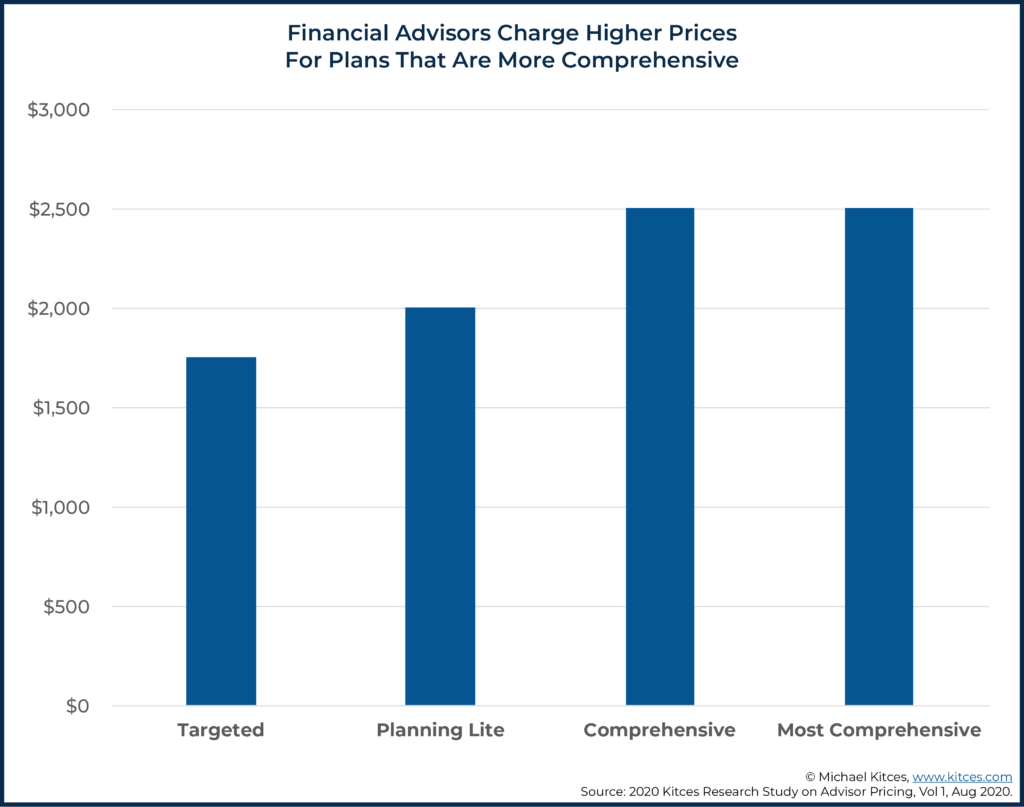
In terms of pricing, we do see that advisors creating more comprehensive plans are charging more, with the median fee for a plan at $2,500 for advisors in both the comprehensive and most comprehensive categories (versus $1,800 for targeted advisors). Though again, median advice fees are not higher for financial plans that are the most comprehensive… which again may help to explain why financial advisors appear to be shifting away from the “most comprehensive” (13+ topic) plans down to ‘merely’ comprehensive (10-12 topic) financial plans that are better targeted to their ideal clientele.
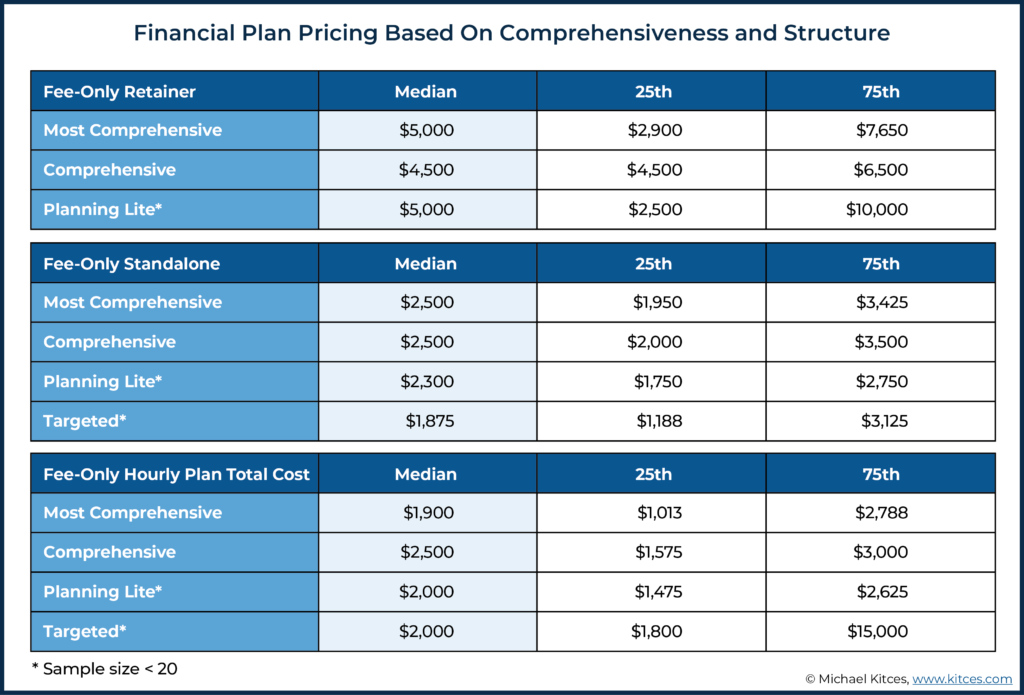
Because revenue generated from product implementation could potentially complicate this analysis, we further examined differences among strictly fee-only advisors using the same 16 comprehensiveness categories described above in our examination of standalone planning fees.
And as these results reveal, there is virtually no appreciable increase in financial planning fees for the most comprehensive financial plans amongst financial advisors charging only planning fees. In fact, median planning fees for the most comprehensive plans were typically no higher than for more targeted “planning lite” financial plans that simply covered the most important 6-9 topics for a particular client. Which further emphasizes that financial planning value is more effectively unlocked by deeply covering a select few topics of greatest relevance and impact for clients, than trying to be the “most comprehensive” in covering them all!
Across all categories, the following table reports 2020 standalone planning fee levels in comparison to what advisors reported in 2018:
As the chart above indicates, most fee levels were flat or positive. Declines were only noted in a few segments and aren’t necessarily statistically significant differences. The most notable increases were observed among solo advisors (both with and without support), who seem to have lifted fees considerably from 2018 at the lower ends of the market (25th and 50th percentiles).
Average Hourly Financial Planning Fees
Hourly fees are another common way for financial advisors to charge, especially for more ad hoc advice work. Advisors within our survey reported not only how much they charge per hour but also metrics such as how many hours they spend working on a typical plan.
Overall, hourly planning rates varied as follows:
- 10th Percentile: $150
- 20th Percentile: $200
- 50th Percentile: $250
- 75th Percentile: $280
- 90th Percentile: $350
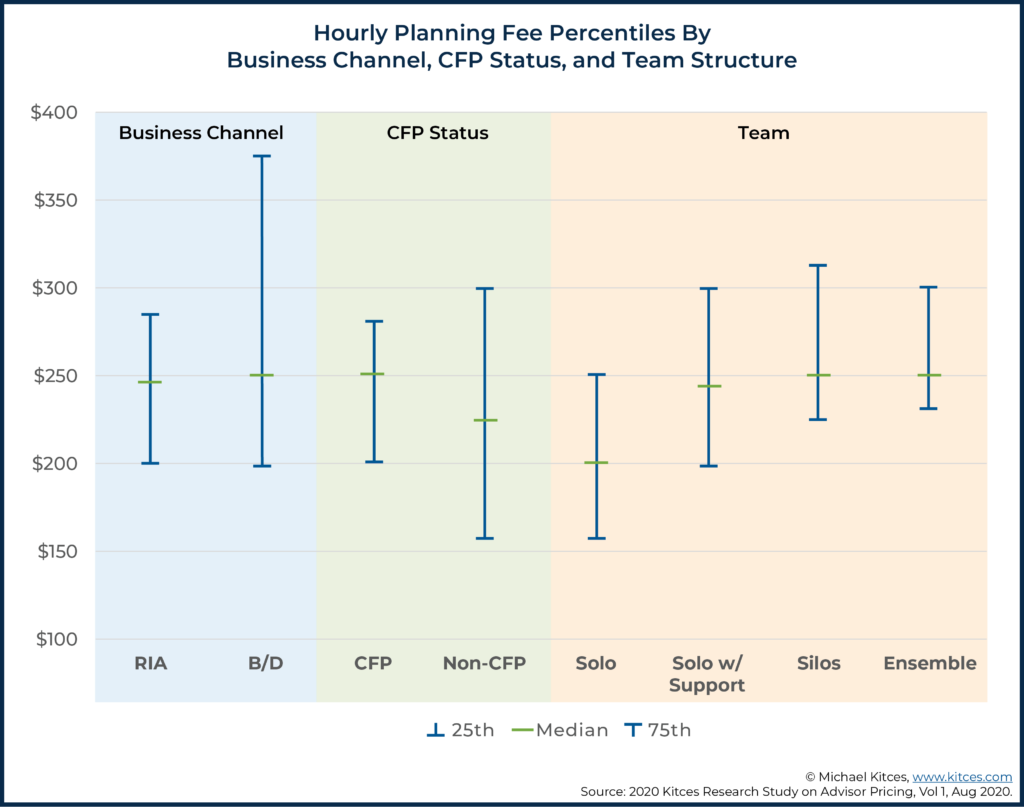
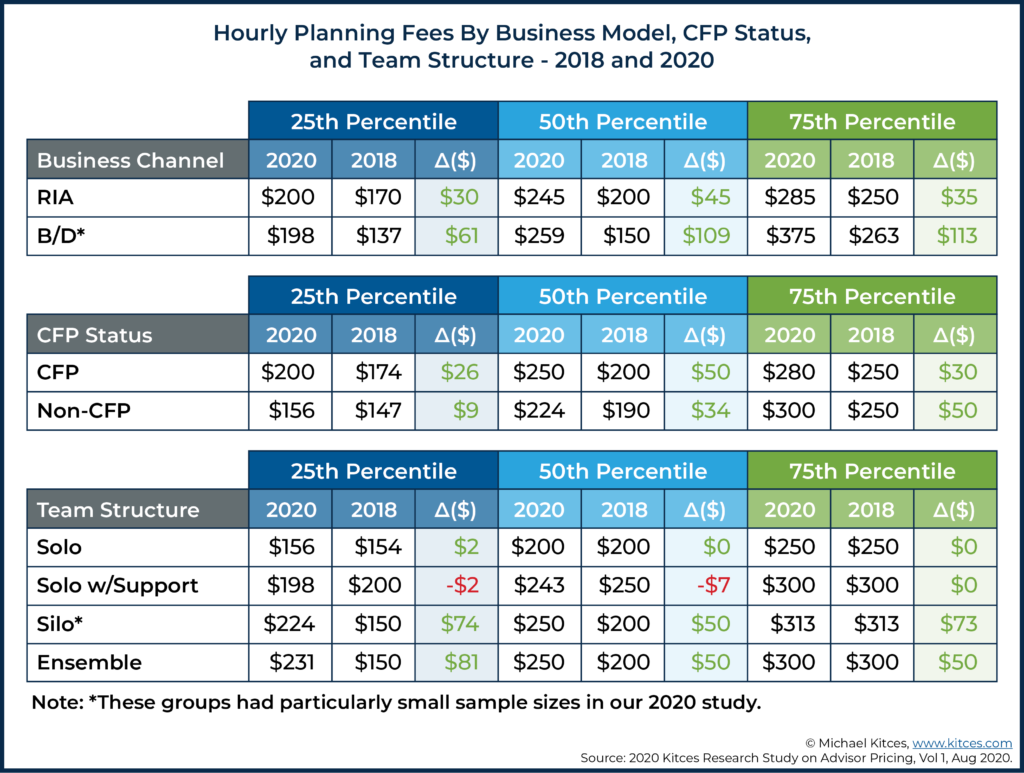
Again, variation in pricing was observed among various advisor demographics. Median hourly rates hovered close to $250 for all groups except for non-CFP professionals and solo advisors, who tended to charge less ($225/hour and $200/hour, respectively). One standout was B/D advisors charging significantly higher at the 75th percentile ($375/hr) than advisors in the RIA channel ($285 at the 75th percentile). And in general, our data showed the largest increases in hourly rates for financial planning amongst advisors at broker-dealers, whose rates are now substantively in line with RIAs (but were consistently lower in the past).
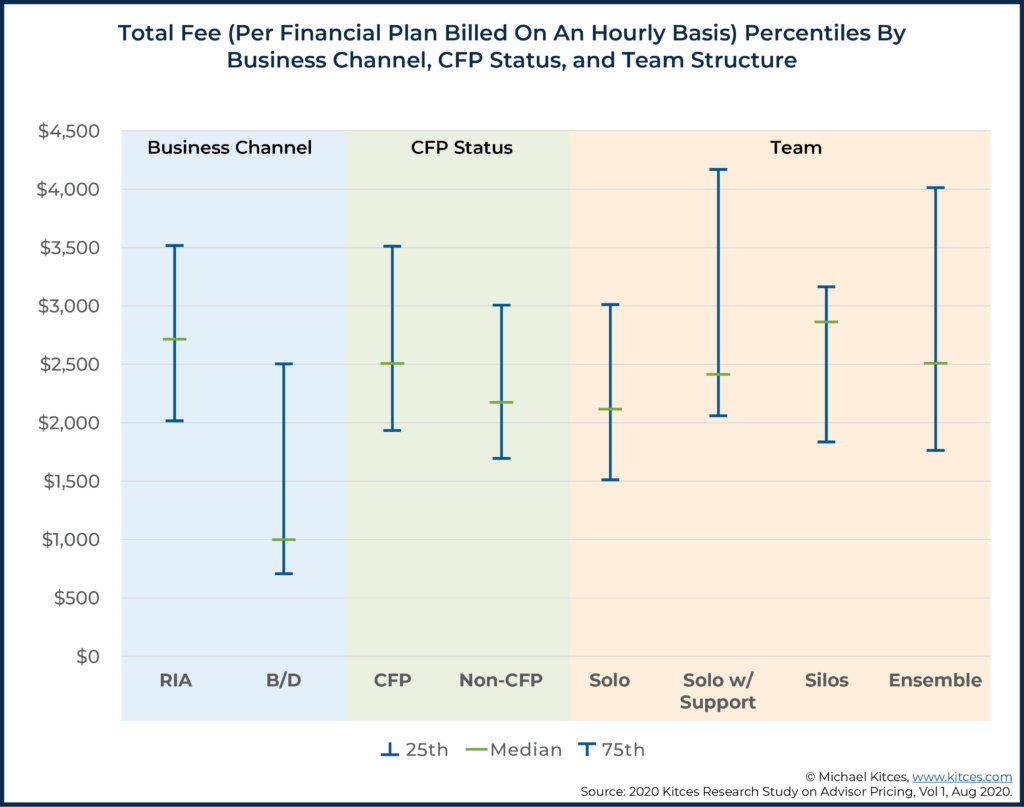
Of course, hourly rate alone does not tell us how much an actual completed plan would cost, since advisors may vary in how much time they spend developing a financial plan (i.e., an advisor charging $300/hour but constructing financial plans in 5 hours will ultimately cost less than an advisor who charges $200/hour but takes 10 hours to complete a plan). Accordingly, we multiplied the number of hours an advisor typically bills for an hourly plan, by their hourly rate, to determine an hourly advisor’s typical fee for a financial plan, as shown below:
In this context, there is clearly more deviation between categories for the total price of a financial plan than was evident by just looking at hourly rates alone. For instance, while advisors in the B/D channel were charging the same or higher hourly rates as RIAs for their plans (as shown in the prior graphic), these advisors are still spending far fewer hours (median of 6 hours in B/Ds versus 12 hours in RIAs) in developing those financial plans, and therefore charging a lower rate overall. Furthermore, advisors within RIAs were significantly more likely to indicate providing “most comprehensive” plans (37.2% vs. 25.0%) and were significantly less likely to indicate providing targeted plans (6.4% vs. 13.1%).
Consequently, median total fees for completed plans billed on an hourly basis among B/D advisors were roughly $1,000 for an hourly plan, versus about $2,700 for advisors within the RIA channel. Similarly, solo advisors without support and non-CFP practitioners were again charging less than most other advisors. More generally, our Kitces Research shows that two factors related to higher financial planning fees are CFP certification (although we cannot necessarily say that the CFP certification causes higher fees; it could just be that more successful advisors are more likely to go on and pursue their CFP) and infrastructure (i.e., team structure and staff support) to be able to produce and deliver more comprehensive (and able to command a higher fee) financial plans.
Regarding changes from 2018 to 2020, we again see almost all increases in advisor hourly fee rates. Though again, some of the largest hourly rate increases were observed among advisors within the B/D channel.
Notably, there’s also likely some ‘stickiness’ to various fee thresholds, as advisors appear to disproportionately set their hourly advice fee rates in $50 increments. From 2018 to 2020, at the median, there was largely a shift from fee levels around $200 up to $250. At higher levels (e.g., the 75th percentile), we start to see pricing that gravitates toward the $300 level, and it’s likely many advisors may make the jump from one $50 increment to the next.
Typical Financial Advisor Retainer And Subscription Fees
Retainers (e.g., annual or quarterly) and monthly subscription fees continue to be a growing form of advisory fees, allowing advisors to provide services to clients that may have substantive income (enough to pay a full-fledged advice fee) but little or no portfolio assets to manage.
Fee levels among advisors within our 2020 study were reported as follows:
- 10th Percentile: $1,210
- 25th Percentile: $2,000
- 50th Percentile: $4,000
- 75th Percentile: $6,200
- 90th Percentile: $8,000
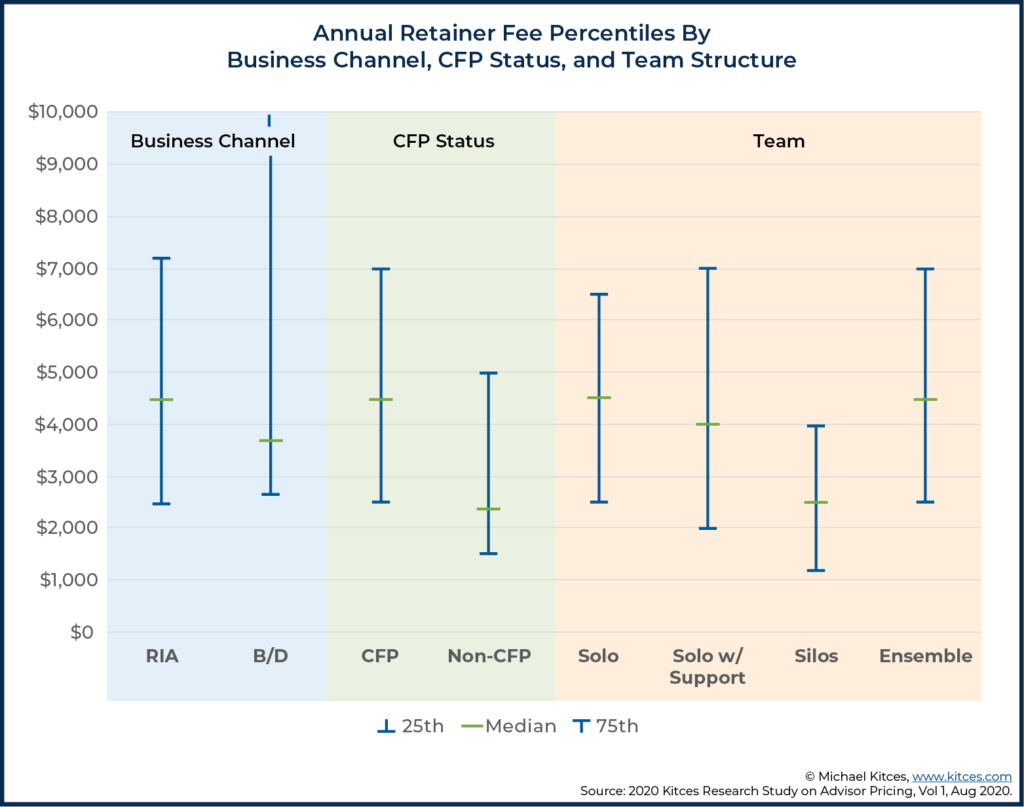
From the minimum to the maximum, annual retainer fees ranged tremendously ($600 to $40,000), though the median retainer fee reported within this range was a fee of $4,000 per year (up from $3,200 in 2018).
Looking at retainer fees by business model, CFP certification status and team structure were relevant factors to consider. CFP professionals charge higher retainer fees than non-CFP professionals, and advisors on ensemble teams charge the most. Though notably, retainer fees for ensembles were only slightly higher than for solo advisors (who appear to be increasingly successful at finding a focused group of retainer-paying clientele to service and implementing the staff support infrastructure necessary to provide more targeted financial plans efficiently to that niche clientele).
On the other hand, it’s also notable that retainer or subscription models introduce unique challenges for financial advisors to “demonstrate their ongoing value” when not tied directly to an investment portfolio being managed.
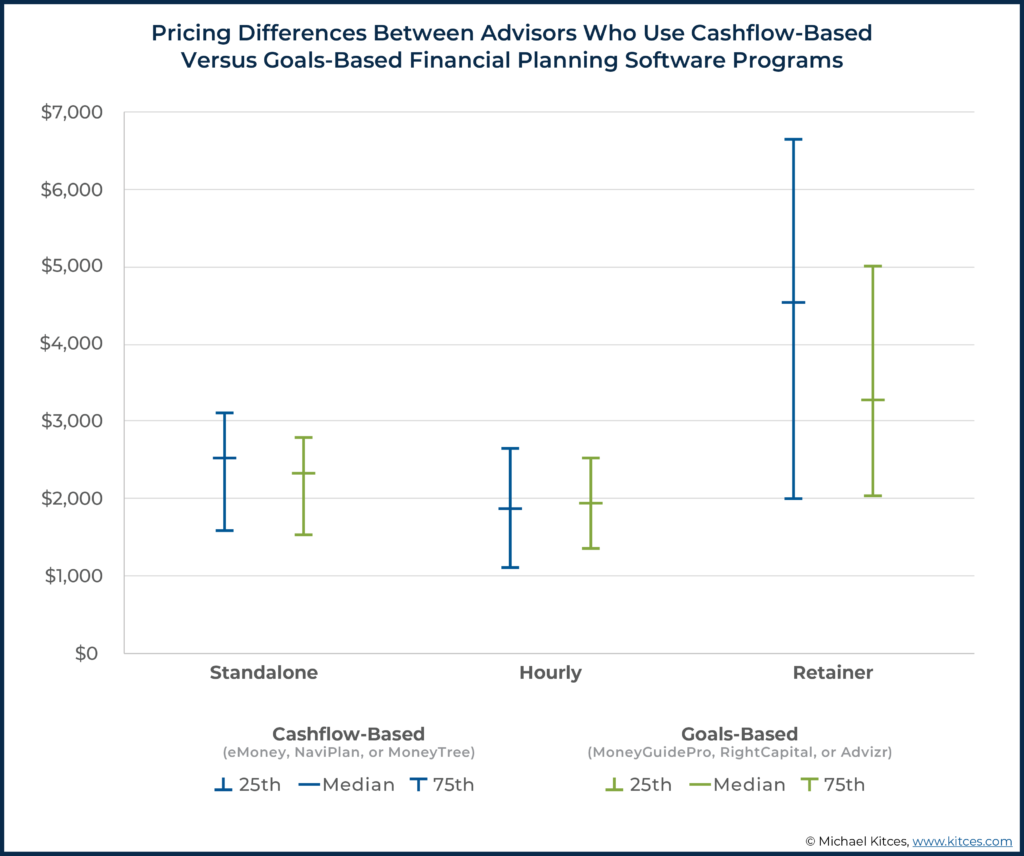
In practice, this pressure is instead being expressed in the choice of financial planning software amongst financial advisors, as our Kitces Research shows some differences in how advisors price their services based on whether they use more detailed cash-flow-driven financial planning software (e.g., eMoney Advisor, NaviPlan, or MoneyTree) versus goals-based planning software (e.g., MoneyGuidePro, RightCapital, or Advizr).
In particular, our results show that financial advisors using cash-flow-based financial planning software charge substantially higher retainer or subscription fees – a median of $4,500 versus $3,250 respectively – and that this distinction is particularly a difference amongst advisors using retainer models (whereas hourly advisors charge similarly for both, and cash-flow-based advisors charge only slightly more for standalone plans than those using goals-based planning software).
However, there are some notable differences between users of particular software companies within each category (cash flow or goals-based). While the median retainer fee among eMoney and MoneyTree users is $4,500 for each, the median among NaviPlan users is only $1,650. Similarly, while median retainer fees for MoneyGuidePro users were $3,500, those same median fees for RightCapital users were only $3,000.
AUM Fees
Because AUM fees are the most common way in which advisors are compensated, our survey also examined AUM fees at various levels of account size.
Advisors reported their AUM fee schedules (either tiered or breakpoint), and, from those fee schedules, we then computed total AUM fees for clients with different portfolio sizes.
Notably, the AUM model is often criticized for the fact that clients with twice the assets to manage may pay twice the fee (calculated as a percentage of that twice-as-large portfolio), but don’t necessarily require twice the work. However, when looking at AUM fees by asset levels, our data shows that advisors do consistently use graduated fee schedules with breakpoints (lower AUM fees at higher thresholds) that at least partially mitigate this effect.
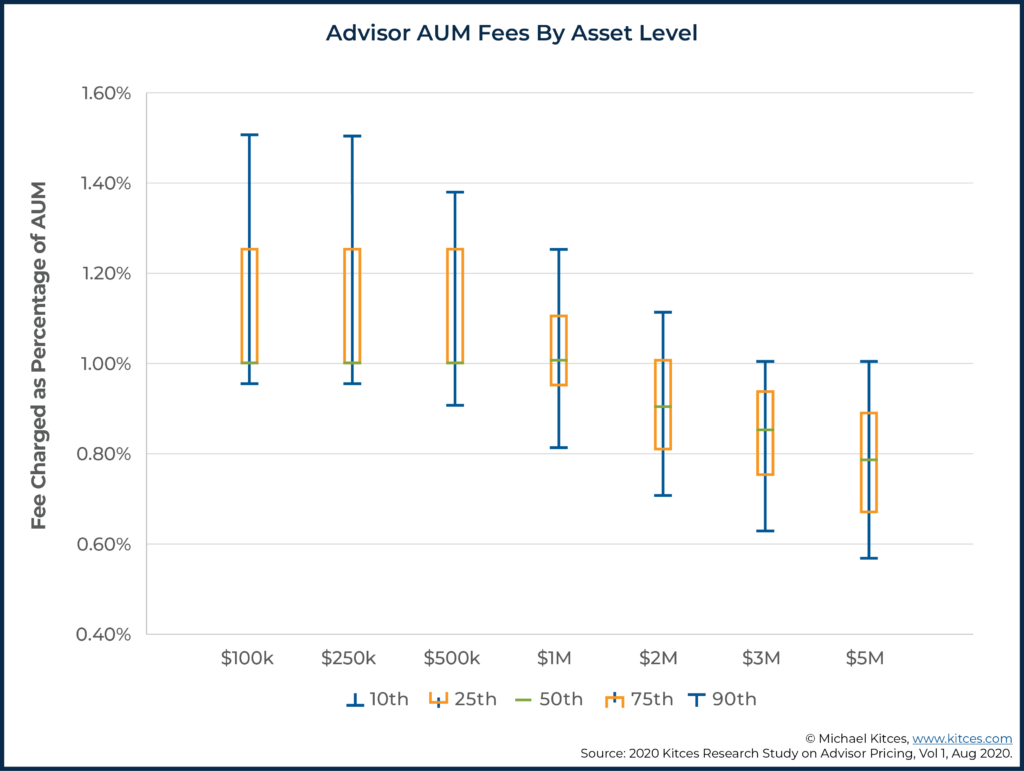
In practice, our Kitces Research shows that median fees were 1.0% of AUM up to $1 million. The median fee then dropped to roughly 0.9% at $2 million and 0.8% at $5 million. Notably, the marginal fee that financial advisors are charging is often lower than these thresholds – especially at higher AUM levels – but because the lower rate is only charged on additional assets above the breakpoint threshold, the actual blended fee that advisors charge (as a percentage of the aggregate portfolio) shows only a more modest decrease in fees as portfolios increase. For instance, an advisor that charges 1% on the first $2.5M and 0.6% on all amounts above that may have a marginal fee of 0.6% for a $5M portfolio, but their actual blended fee on that $5M portfolio would be 0.8% of the account balance.
At the higher end (90th percentile), financial advisors reported charging roughly 1.5% for portfolios of up to $250k, 1.3% at $1 million, 1.1% at $2 million, and 1.0% up through $5 million.
In comparison to our 2018 study, we again do not see much evidence of fee compression, except for some possible compression at the very low-end for $100k portfolios. Interestingly, we actually see slightly higher fees for larger portfolios in comparison to our 2018 study.

Nerd Note:
These results may also be impacted by a change in our survey methodology. In 2018, we asked advisors to report their own blended fees. In 2020, we asked advisors to report their fee schedule, and then calculated their blended (or breakpoint) fees for them.
We suspect that some advisors in 2018 may have been reporting marginal fees (i.e., fees on the next dollar of assets) rather than actually determining their blended fees for tiered AUM portfolios, which would become particularly noticeable at higher AUM levels and result in an under-reporting of fees in 2018. Nonetheless, it is still interesting to see from the 2020 research results that 1.0% AUM fee remains dominant up through $1 million in AUM and, even beyond that AUM level, median fees are only dropping to roughly 0.8% for $5 million portfolios.
Overall, percentage-based AUM fees in 2020 were roughly in line with what we observed in 2018. Of course, rising asset values over this time period have also meant higher dollar fees (and income) for financial advisors, even though fee schedules themselves have remained the same. In turn, this trend of higher advisor income and compensation (not lower, despite rumors and fears of fee compression) is mirrored in the dollar-based fees results (e.g., hourly fees, standalone planning fees), which are also up substantively (and far more than inflation alone) from 2018.
While we cannot speak to what is driving this increase, per se, it will be interesting to see if these fees experience any contraction during future market declines. If so, it may be that although these fees are dollar-based, there may be a sort of ‘rising-tide-lifts-all-boats’ effect associated with advisory fees. On the other hand, it would not be surprising for these fees to remain more stable than AUM-based fees.
AUM Fee Trends Across Different Advisor Segments
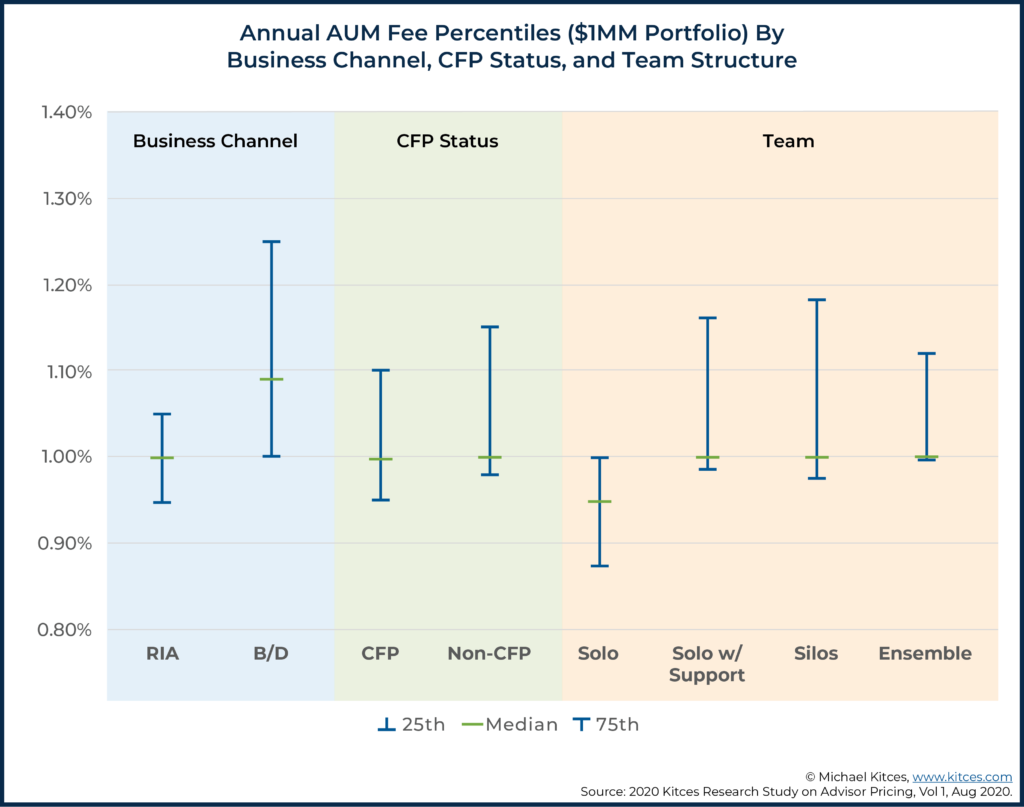
When looking at AUM fees for clients with a $1 million portfolio by business model, CFP certification status, and team structures, a median of 1.0% in AUM fees was fairly consistent across all advisor segments, with the exception of advisors within B/Ds charging more (1.1%) and solos charging less (0.95%).
Notably, though, the trend of advisors at broker-dealers charging more than any other advisor type was very pronounced at all fee percentiles for a consistent client size (a $1M portfolio), with a median of 1.1% and 75th percentile of 1.25% within B/Ds versus a median of 1.0% and 75th percentile of 1.05% within RIAs. Which at an additional AUM fee of approximately 15% to 20% charged by advisors within B/Ds is roughly in line with the additional costs that B/D-based advisors incur between grid-based payouts and additional platform costs. This may suggest that broker-dealers are adding a non-trivial cost layer to the AUM model, which in turn is being passed through to consumers in the form of higher fees, and that perhaps RIAs may in fact be enjoying a growing competitive price advantage by eliminating a layer of broker-dealer intermediaries when going independent.
Surprisingly, there is little difference in AUM fees between CFP professionals and non-CFP professionals (median fees for a $1M client were roughly 1.0% of AUM for each group in 2018 and 2020). However, it is still worth noting that while CFP practitioners may not be charging higher AUM fees, we did see CFP practitioners charging higher financial planning fees across the various pricing structures illustrated earlier (e.g., standalone planning fees, total fees per financial plan billed on an hourly basis, and retainer fees for financial planning), which may be an indication of where CFP professionals perceive the value they can deliver to clients. Furthermore, our data does suggest that CFP professionals tend to serve more affluent clientele, so CFP professionals charging the same AUM rates are still often generating more revenue.
On the other hand, while solo advisors tended to price higher than silos when doing standalone financial plans, the reverse was reported with respect to AUM pricing where solo advisors appear to price lower than silos. One explanation for this could be that advisors within different team structures are bundling services differently, perhaps with advisors in silos relying more on AUM as a primary revenue source, and solo advisors being more likely to utilize AUM as a supplemental secondary revenue source to planning fees (or conversely using planning fees to supplement their lower AUM fees).
What Is A Financial Advisor’s Time Really Worth?
Given the highly detailed information provided by financial advisors (again, thank you to those who participated in this study!), we also analyzed what an advisor’s time is actually “worth” – billed as an hourly rate for their client-specific activities – once we account for all the different types of activities they are engaged in (and the different business models by which advisors are compensated).
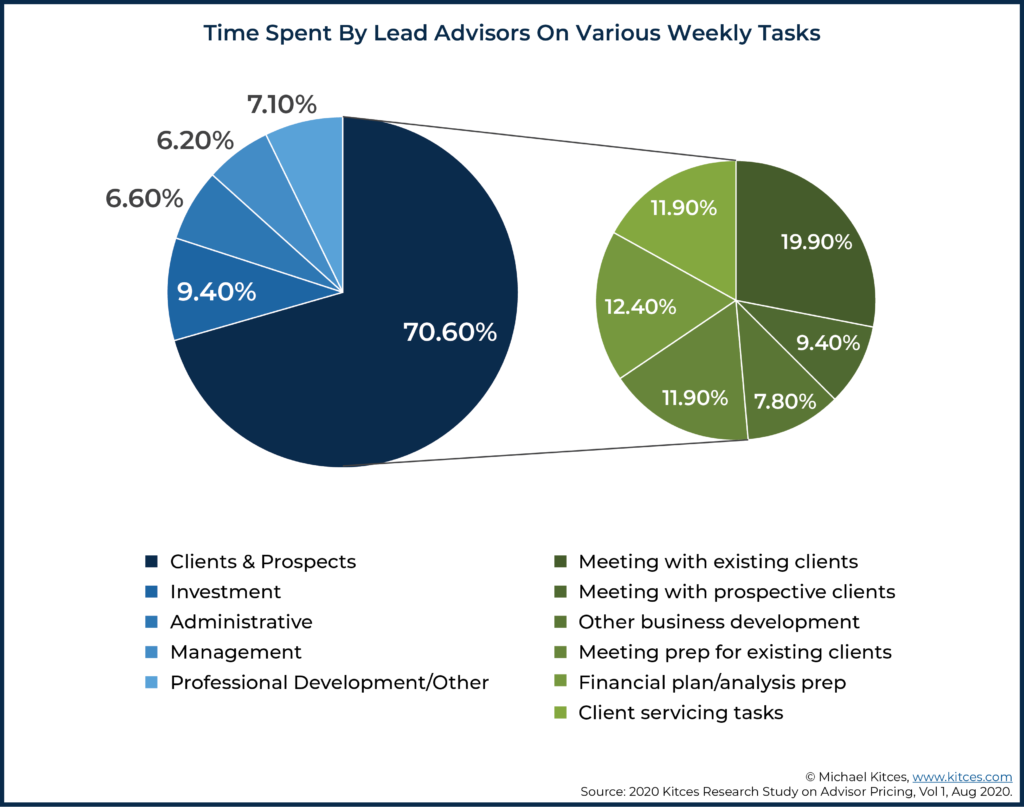
When evaluating the typical time spent by a lead financial advisor throughout the week, tasks fall into a wide range of categories, including business development with prospects, meetings with existing clients, meeting and plan preparation to client reviews, professional development, internal management tasks, and more.
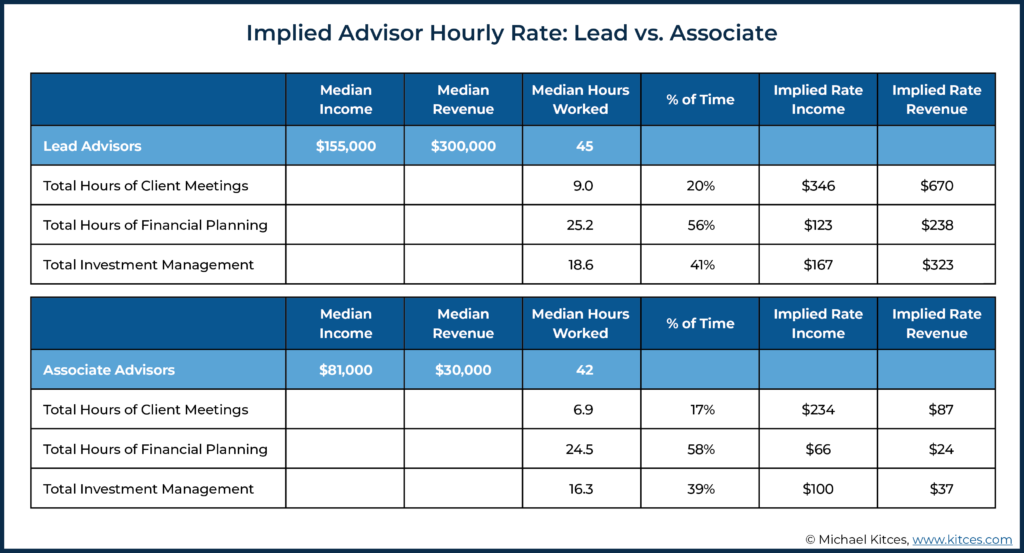
If the focus is on financial planning-specific tasks in particular—i.e., client meetings, financial plan preparation, and meeting preparation—these tasks tend to take up about 56% of a lead advisor’s time.
If we allocate that time to client-specific tasks (i.e., the kind that a financial advisor could actually bill for!), across median lead advisor income ($155,000) or revenue ($300,000), that implies an hourly equivalent revenue rate of $238 per hour, or an income level of $123 per hour. In other words, when aggregated across all types of business and revenue models – from actual hourly advisors, to AUM advisors – the amount of revenue an advisor generates relative to their time actually spent “doing financial planning for clients” amounts to $238/hour.
By contrast, when evaluating investment management services that advisors provide – from the back-office investment research and due diligence to the associated meeting preparation and actual meeting time with clients – the equivalent hourly rate is approximately $323/hour (of which the lead advisor on average earns $167/hour). Even though in practice investment management is charged on a predominantly AUM basis, the hourly rate is still substantively similar to what hourly advisors charge (though notably, higher than financial planning hourly rates, which suggests either that investment management tasks are still more prone to fee compression, that advisors are still undercharging for financial planning, or, alternatively, that financial planners are not sufficiently delegating financial planning support tasks to free up more of their time for the highest-value client work).
In turn, rates for time spent on broadly financial-planning-related tasks are lower for associate advisors (e.g., $210/hour implied rate of revenue; $66/hour implied rate of income).
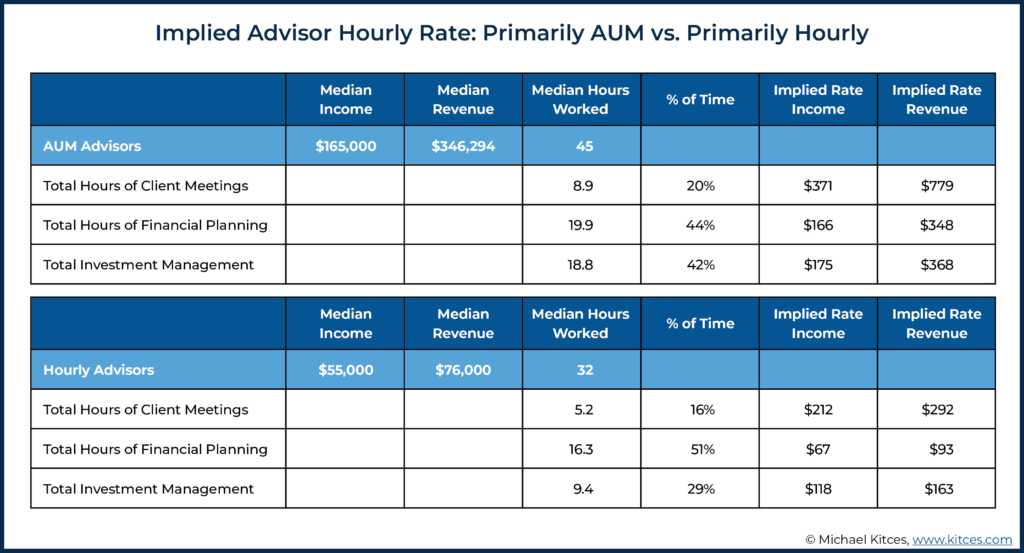
Our study also provides some interesting insight into some of the challenges of running an hourly firm. Looking at only those who identify their firms as primarily AUM versus primarily hourly, those who are compensated primarily via AUM reported higher implied rates of income for financial planning ($166/hour versus $67/hour) and revenue per hour ($348 versus $93).
This challenge may be particularly noteworthy with respect to the challenges of growing an hourly practice. If hourly advisors want to replicate the type of financial success that AUM advisors have achieved, they would need to bring in about $350/hour (of financial-planning-related tasks) in revenue versus the roughly $93/hour that hourly advisors report. Or viewed another way, the AUM model is very ‘forgiving’ in that the client pays an aggregate AUM fee and the advisor then feels compelled to do more/enough work to justify their value and retain the client, but doesn’t have to worry about doing work that isn’t paid for; by contrast, hourly advisors appear to often struggle in actually billing for all the work they actually do when being paid by the hour (even at a median rate of $250/hour!).
Furthermore, if advisors within primarily hourly practices want to be able to attain the same level of financial success as top earners within primarily AUM firms (or if top AUM earners simply want to understand what a “reasonable” hourly rate is given their existing AUM business), then hourly rates much higher than typically observed would be required. To examine this, we defined a “top earner” as those earning between the 85th and 95th percentiles (we used an upper cutoff to ensure that extreme outliers aren’t driving our result, but it should be noted that the top 5% of advisors are actually charging implied hourly rates even higher than reported below).
Here we observe that top-earning AUM advisors (those between the 85th and 95th percentile) are taking home a median of $500,000 in income based on $936,000 of revenue. Notably, these advisors are spending a greater percentage of their time actually doing highly valued client-facing work, and once we account for that, these advisors are still charging an implied hourly rate somewhere between about $950/hour (total financial planning hours) to $1,600/hour (total hours of client meetings). Notably, there’s some clear incongruence here between what some regulators perceive to be maximum “reasonable” hourly fees for an advisor (e.g., no higher than $250/hour) and the implied hourly rates that top-performing AUM advisors are actually commanding in the marketplace.
Key Takeaways On Financial Advisor Pricing
Despite the ongoing fee compression amongst financial services products (and, in some categories, an outright race-to-zero!), our latest Kitces Research continues to show very little indication of fee compression amongst financial advisors themselves.
Unfortunately, though, the overlapping nature of so many types of advisor compensation does make it hard to sort out the true cost of a comprehensive financial plan.
For instance, commissions from product implementation continue to be a source of additional revenue for many advisors who can receive such compensation on top of providing financial planning services for a fee, and even fee-only advisors may receive additional income from follow-up consultations, or implementation in other areas (e.g., AUM fees for portfolio management, on top of fees received for financial planning that include recommendations at the outset for how to manage the client’s portfolio).
In addition, some advisors are also willing to do some hourly or standalone financial planning work, as a way of producing a possibility of future work. This probabilistic, expected-value approach to completing a plan, part as compensation now and part as a means to future compensation, complicates matters considerably.
Nonetheless, our Kitces Research broadly shows that financial planning fees are on the rise, both with respect to the rates that advisors charge, and the frequency of charging additionally or separately for financial planning on top of their other (AUM or commission-based) implementation services.
In turn, the advisors having the most success actually appear to be serving a deeper (and more targeted) niche where they can charge higher fees but not necessarily need to do the most comprehensive (and time-consuming) financial plans. In fact, one of the most striking results of this research is that comprehensiveness alone is not a predictor of advisor pricing, and merely covering a lot of different categories could itself be an indication that an advisor is overly generalized and not focused enough in delivering significant value to a particular niche.
In other words, by spreading oneself thin and trying to serve everyone, advisors can create conditions where there are fewer planning efficiencies (because the advisor has to be able to address a broader number of topics that you may not regularly address) and less deep value provided to a client that would otherwise help an advisor move upmarket (even within a given niche) in the first place.
Nonetheless, our results also show that the AUM model continues to dominate the financial advice landscape, with little sign of abatement. This may be, in part, because the AUM model appears to be much more profitable, which may be due to the fact that AUM pricing is inherently more value-driven (or at least affluence-driven) than hourly planning that is highly dependent on planning inputs.
On the other hand, our research also shows that retainer and subscription-based financial planning models are on the rise as well, with some of the strongest fee increases in recent years, and a growing indication that such models are attracting a distinctly different (non-AUM, though still high-income) clientele.
Though regardless of the particular business model, with advisors spending only approximately 50% of their time on financial planning-related tasks (and of this time, only 20% in direct client-facing meetings!), leveraging one’s own time within their practice becomes a tremendous opportunity to become more efficient, whether through joining an “ensemble” firm, or hiring support staff as a solo advisor.





Leave a Reply