You know what they say, “For every minute spent organizing, an hour is earned.” And when it comes to accounting, taking time to get organized can save you a number of hours later … not to mention, money. That’s why you need your trusted organizational accounting tool, aka your chart of accounts (COA). What is a chart of accounts?
What is a chart of accounts?
A chart of accounts (COA) is a bookkeeping tool that lists all the accounts you record transactions in. These are also the accounts included in your general ledger. By providing an easy-to-read overview of all your business accounts, the chart of accounts shows where money is going, which can help with forecasting and cutting expenses.
Your COA breaks down your business’s transactions into five main accounts and as many sub-accounts as you need for budgeting and tax purposes.
The five types of accounts in accounting are:
- Asset accounts
- Liability accounts
- Equity accounts
- Income (Revenue) accounts
- Expense accounts
Asset accounts
So, what are assets? Your assets are the tangible and intangible things you own that add value to your business. A business bank account (e.g., checking) is an example of an asset.
You can have both current and non-current assets. Current assets are items of value you can convert to cash within one year, like accounts receivable. On the other hand, a non-current asset is a long-term asset that generally doesn’t convert into cash within one year, like a car.
Recording transactions: Debits increase assets and credits decrease them
Liability accounts
Liability accounts reflect the debts your business owes. Loans and accounts payable are examples of liabilities you might incur.
Your liabilities can be short-term or long-term. Short-term, or current, liabilities are debts that you expect to pay within one year, like accounts payable. Long-term, or non-current liabilities, are debts that take more than one year to pay off, like a business loan.
Recording transactions: Credits increase liabilities and debits decrease them
Equity accounts
Your equity shows you how much your business is worth. You can find business equity by subtracting your liabilities from your assets. The more liabilities you incur, the more your equity decreases.
Recording transactions: Credits increase equity and debits decrease them
Income accounts
Business income, or revenue, is the money your business generates, either from operations (e.g., product sales) or non-operations (e.g., interest). So when your business earns money, record the transactions in your income accounts.
Recording transactions: Credits increase income and debits decrease them
Expense accounts
Last but not least, your expense accounts are where you record your business’s expenses. Expenses are the costs you incur during operations, like advertising and payroll costs.
Recording transactions: Debits increase expenses and credits decrease them
Chart of accounts list
Now that you know chart of accounts definition, it’s time to see how it works. When you record transactions, you add them to sub-accounts. The sub-accounts are then categorized in the five main accounts (e.g., asset account). The sub-accounts you use depend on your business.
So, how exactly should your accounting chart of accounts look? Although the sub-accounts you use may vary, here’s an example of how you might organize your COA:
- Asset accounts
- Checking
- Savings
- Petty Cash
- Accounts Receivable
- Liability accounts
- Accounts Payable
- Sales Tax Collected
- Payroll Tax Liability
- Equity account
- Owner’s Equity
- Income accounts
- Bank Account Interest
- Product XYZ Sales
- Miscellaneous Income
- Expense accounts
- Advertising
- Equipment
- Insurance
- Office Supplies
- Payroll Expense
Regardless of the sub-accounts you use, a COA can help you stay organized, keeping your accounting books clear and understandable. That way, you aren’t listing every transaction under one of the five main accounts. Instead, you list them under their respective sub-accounts.
How to set up a chart of accounts
Now that you know what is a chart of accounts, you need to know how to create one. Assign a group of numbers to each of the five categories. Then, number each account to match the category it belongs in.
For example, your assets are 100-199. Since cash is an account under the assets category, you would number it in the 100s.
You can decide on a numbering system that works best for your business. Depending on your business size, you might use smaller numbers than a large corporation (e.g., three digits vs. four digits). For example, your COA could look like this:
- Assets: 100 to 199
- Checking: 105
- Savings: 115
- Liabilities: 200 to 299
- Accounts Payable: 205
- Sales Tax Collected: 220
- Equity: 300 to 399
- Owner’s Equity: 315
- Income: 400 to 499
- Bank Account Interest: 420
- Product XYZ Sales: 440
- Expenses: 500 to 599
- Advertising: 540
- Equipment: 550
- Insurance: 570
On the other hand, large businesses typically use four-digit numbers (e.g., 1000). If your business grows substantially, you will likely need to add numbers.
Regardless of your chart of accounts numbering, make sure it makes sense to you. The purpose of the numbers is to make recording transactions easier. Some small business owners use a combination of letters and numbers (e.g., A100).
Leave empty numbers in between accounts so that you can add to them in the future. Try to keep your accounts consistent so that you can compare your business’s financial health from one year to the next.
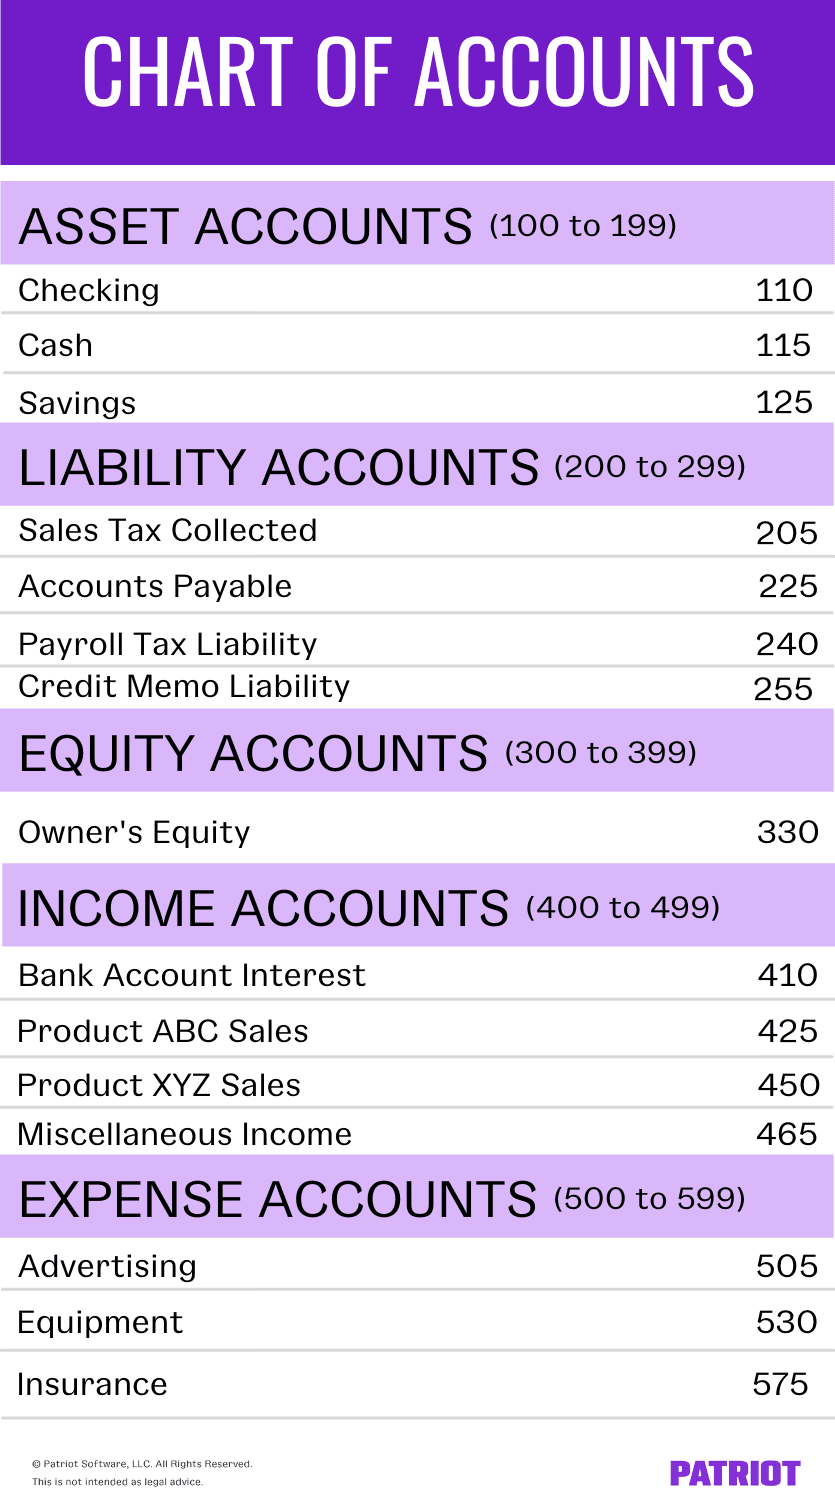
Chart of accounts example
To get more of a visual, here is a sample chart of accounts:

Staying on top of your business’s accounting records can take up your time. Patriot’s accounting software lets you create invoices, record payments, and so much more. Try it for free today! Your organized books will thank you.
This article was updated from its original publication date of June 24, 2014.
This is not intended as legal advice; for more information, please click here.
Leave a Reply